The FBI's violent crime rate blended with its property crime rate, per 100,000 residents, for the latest full year: a city's own police department, a state's own summary.
The Honest LocalA community forum for neighbors
Rankings · Safest Cities
Safest Cities, Provo, Utah Leads (2026)
Provo, Utah is the safest of the 96 US cities we rank, with a Safety Score of 94.3 out of 100 and 177 violent crimes per 100,000 residents (FBI, 2025). McAllen, Texas is next, with a Safety Score of 90.6.
Ten cities aren’t ranked, among them Chicago, Illinois and Jackson, Mississippi, whose police departments’ FBI files fall far short of the departments’ own counts. Which cities, and why
By The Honest Local · 96 cities · every value links to its public source
94.3Provo, Utah leads on The Honest Local Safety Score, 96 of the 106 cities we coverViolent crime and property crime, per person, blended into one number.
The top five cities
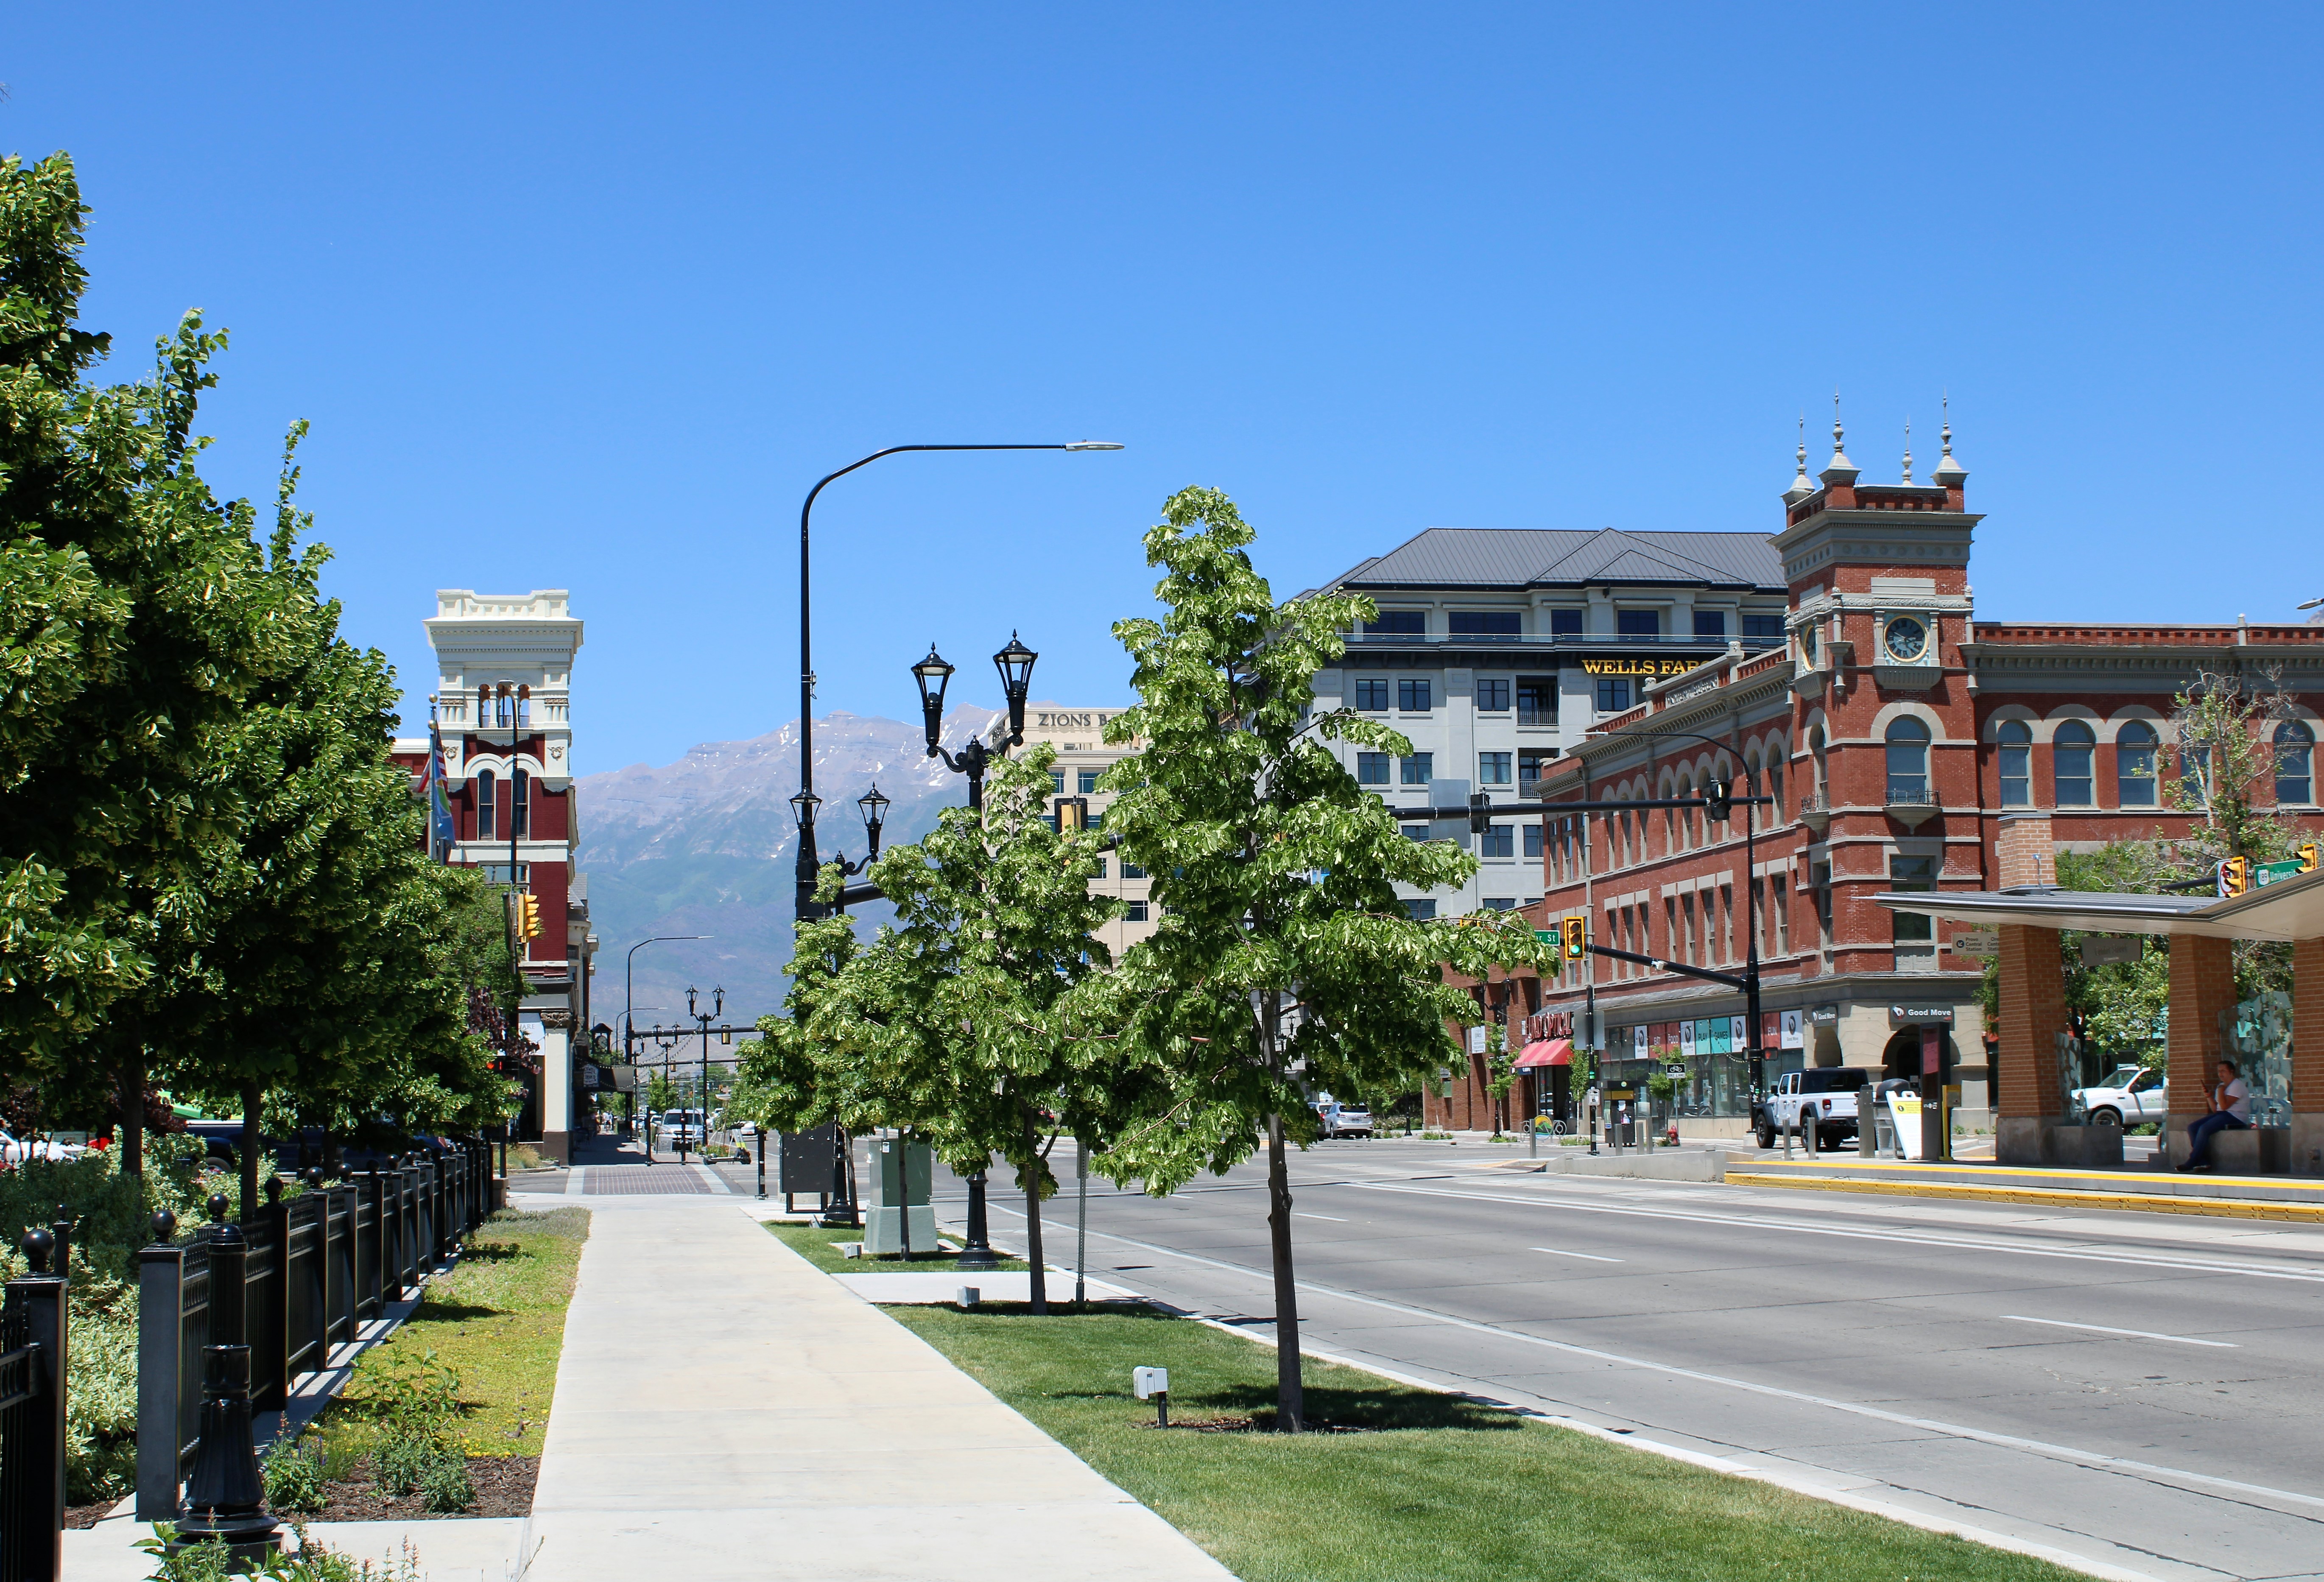
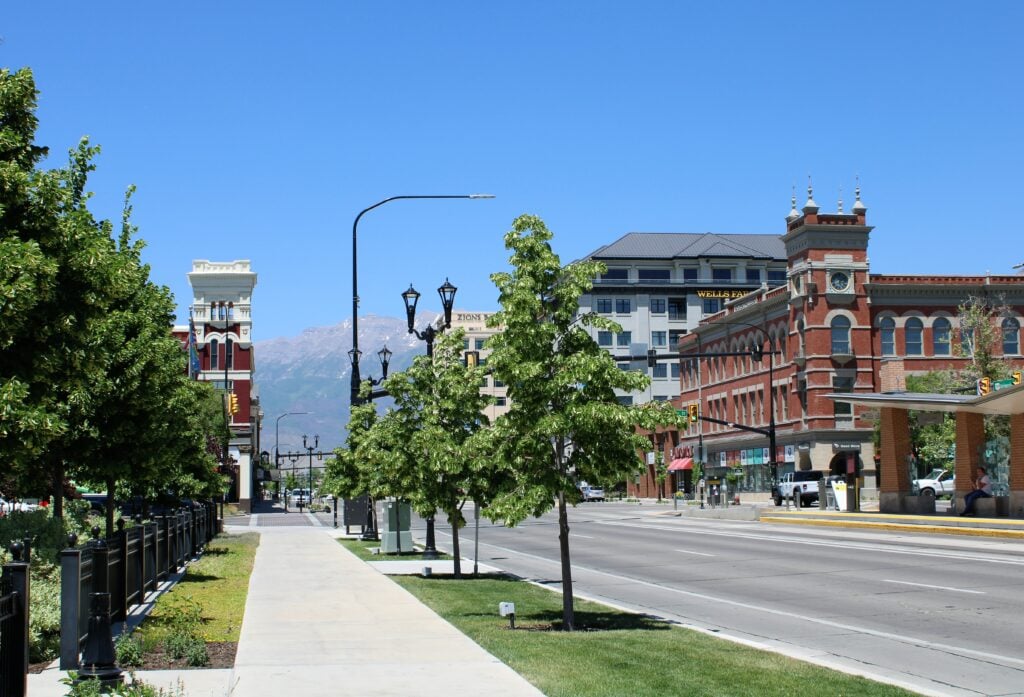 No. 1Provo, Utah94.3177 violent per 100k
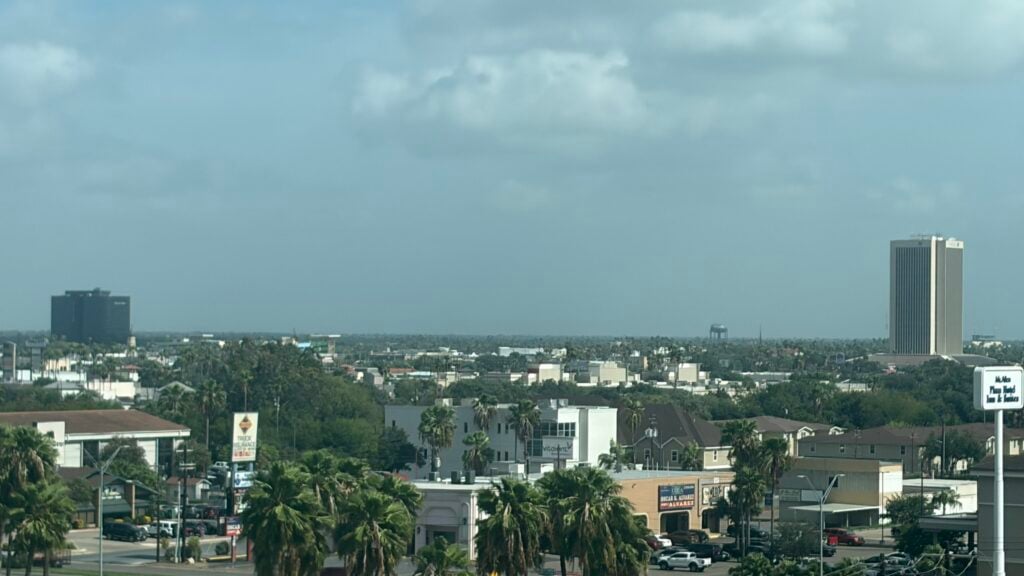 No. 2McAllen, Texas90.6126 violent per 100k
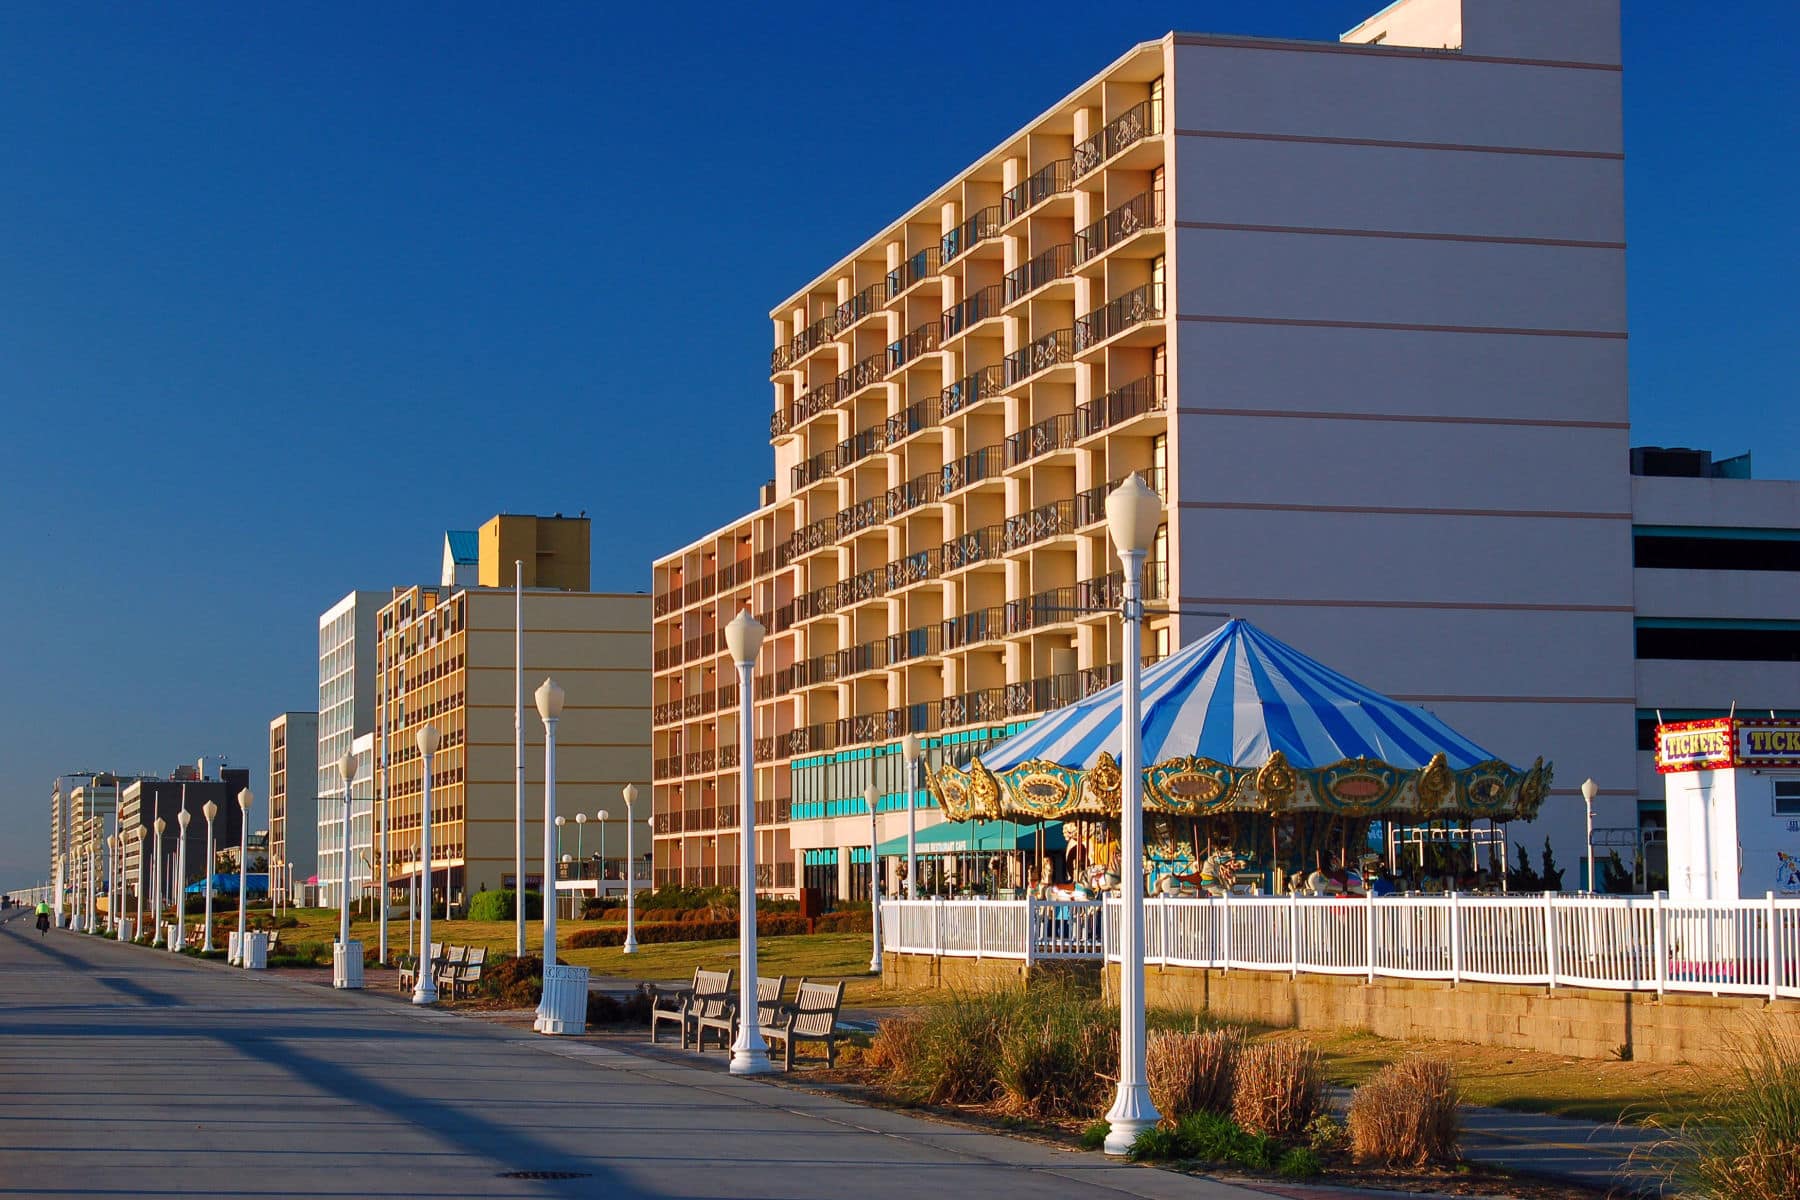 No. 3Virginia Beach, Virginia88.8101 violent per 100k
 No. 4Boise, Idaho88.5290 violent per 100k
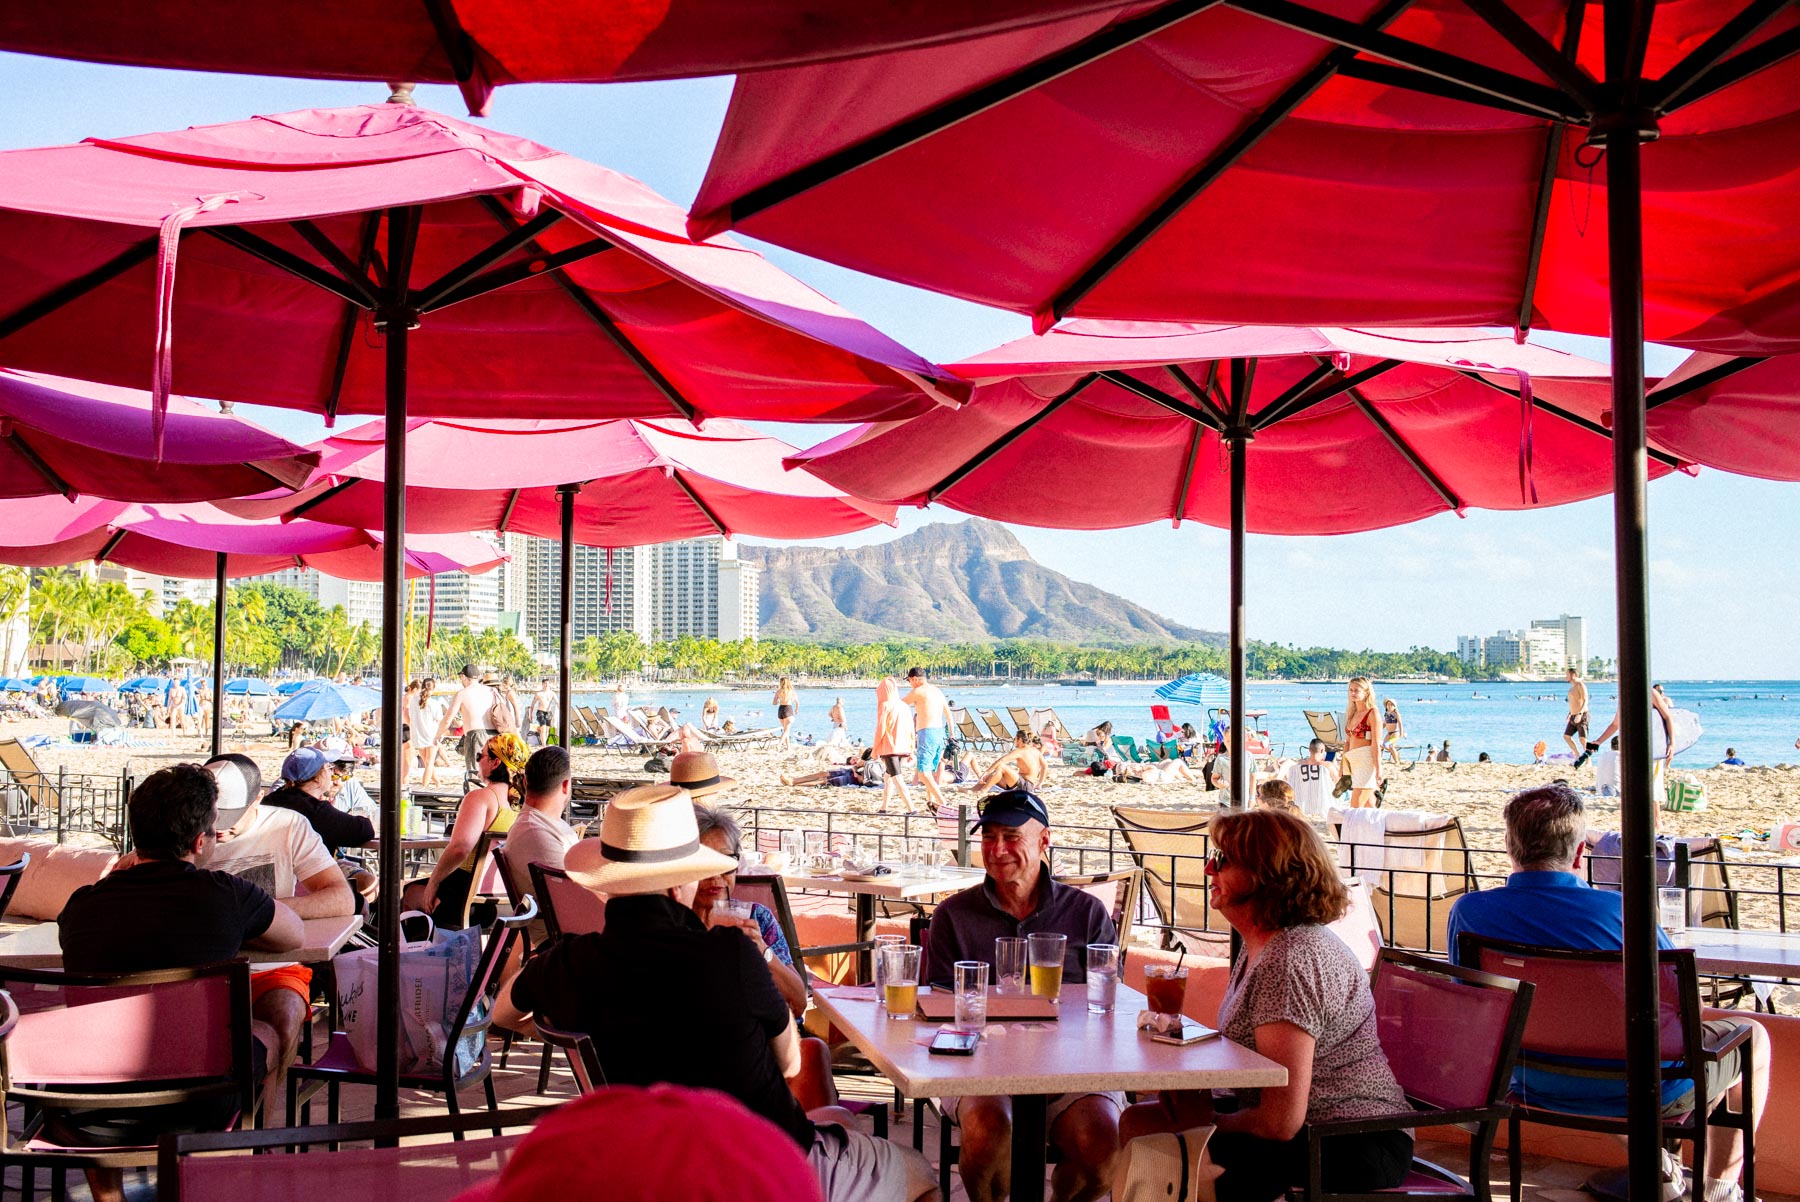 No. 5Honolulu, Hawaii87.4181 violent per 100k
Safest Cities on the map
Safety Score, cities
Loading the numbers…
Safest Cities, all 96
The full ranking
| Place | Safety Scoreout of 100 | Violent crime | Property crimeper 100k | |
|---|---|---|---|---|
| 1 | Provo, Utah | 94.3 | 17796 | 111993 |
| 2 | McAllen, Texas | 90.6 | 12697 | 142284 |
| 3 | Virginia Beach, Virginiabig city | 88.8 | 101100 | 148678 |
| 4 | Boise, Idaho | 88.5 | 29078 | 85299 |
| 5 | Honolulu, Hawaiibig city | 87.4 | 18195 | 145980 |
| 6 | Tampa, Floridabig city | 86 | 33376 | 99196 |
| 7 | El Paso, Texasbig city | 83.4 | 28879 | 134288 |
| 8 | Allentown, Pennsylvania | 81.6 | 26482 | 143581 |
| 9 | Providence, Rhode Island | 76.2 | 28781 | 157572 |
| 10 | Charleston, South Carolina | 75.8 | 28181 | 161370 |
| 11 | Madison, Wisconsinbig city | 75.4 | 21491 | 188259 |
| 12 | Sarasota, Florida | 75.1 | 38268 | 143383 |
| 13 | Lakeland, Florida | 72.3 | 37069 | 154075 |
| 14 | San Diego, Californiabig city | 71.1 | 37668 | 155674 |
| 15 | Portland, Maine | 69.7 | 25184 | 194356 |
| 16 | Poughkeepsie, New York | 66.6 | 56040 | 110894 |
| 17 | Ogden, Utah | 62.5 | 44655 | 162770 |
| 18 | Worcester, Massachusetts | 59.3 | 60237 | 143382 |
| 19 | Melbourne, Florida | 57.8 | 45554 | 182962 |
| 20 | Fayetteville, Arkansas | 56.7 | 44755 | 191159 |
| 21 | Huntsville, Alabama | 55.6 | 39963 | 229748 |
| 22 | Raleigh, North Carolinabig city | 55.2 | 39564 | 230546 |
| 23 | Oxnard, California | 54.9 | 55841 | 163869 |
| 24 | Omaha, Nebraskabig city | 53.8 | 35073 | 279535 |
| 25 | Columbus, Ohiobig city | 52.7 | 38267 | 253938 |
| 26 | Hartford, Connecticut | 50.9 | 45953 | 226349 |
| 27 | Las Vegas, Nevadabig city | 50.2 | 41361 | 242539 |
| 27 | Miami, Floridabig city | 50.2 | 48350 | 224350 |
| 29 | Jacksonville, Floridabig city | 49.5 | 51946 | 217353 |
| 30 | Bakersfield, Californiabig city | 49.1 | 49649 | 226049 |
| 31 | Harrisburg, Pennsylvania | 48.4 | 63435 | 182562 |
| 31 | Riverside, Californiabig city | 48.4 | 53545 | 218052 |
| 33 | Boston, Massachusettsbig city | 47 | 58337 | 193157 |
| 34 | Pittsburgh, Pennsylvaniabig city | 46.6 | 46852 | 237041 |
| 35 | San Jose, Californiabig city | 43.7 | 50548 | 240440 |
| 36 | New Haven, Connecticut | 43.6 | 39963 | 311625 |
| 37 | Reno, Nevadabig city | 43 | 55142 | 234744 |
| 38 | Austin, Texasbig city | 42.8 | 42360 | 310125 |
| 39 | Greenville, South Carolina | 41.9 | 46553 | 286631 |
| 40 | Phoenix, Arizonabig city | 40.5 | 69727 | 205254 |
| 41 | New York, New Yorkbig city | 39.8 | 66032 | 230147 |
| 42 | San Francisco, Californiabig city | 39.7 | 48650 | 296030 |
| 43 | Richmond, Virginia | 38.6 | 44256 | 335021 |
| 44 | Rochester, New York | 36.5 | 57239 | 281834 |
| 45 | Vancouver, Washington | 36.1 | 55642 | 289030 |
| 46 | Knoxville, Tennessee | 35.8 | 68529 | 235943 |
| 47 | Sacramento, Californiabig city | 34.7 | 72024 | 230846 |
| 48 | Des Moines, Iowa | 33.2 | 64234 | 283833 |
| 48 | Oklahoma City, Oklahomabig city | 33.2 | 68230 | 266036 |
| 50 | Dallas, Texasbig city | 32.5 | 57738 | 307827 |
| 51 | Durham, North Carolinabig city | 32.1 | 50747 | 359917 |
| 52 | Los Angeles, Californiabig city | 31.7 | 67032 | no reading |
| 53 | Fresno, Californiabig city | 30.8 | 72025 | 258037 |
| 54 | Charlotte, North Carolinabig city | 30.3 | 55940 | 341720 |
| 55 | Augusta, Georgia | 29.6 | 54943 | 365316 |
| 55 | San Antonio, Texasbig city | 29.6 | 53245 | 391814 |
| 57 | Syracuse, New York | 29.3 | 61236 | 321823 |
| 58 | Colorado Springs, Coloradobig city | 27.8 | 69128 | 303128 |
| 59 | Grand Rapids, Michigan | 27.5 | 89411 | 233444 |
| 59 | Greensboro, North Carolinabig city | 27.5 | 70426 | 298129 |
| 61 | Stockton, Californiabig city | 26.8 | 10299 | 232145 |
| 62 | Chattanooga, Tennessee | 26.3 | 67931 | 331422 |
| 63 | Indianapolis, Indianabig city | 26 | 76919 | 281933 |
| 64 | Albany, New York | 25.7 | 83216 | 271536 |
| 65 | Toledo, Ohiobig city | 25.3 | 87213 | 254238 |
| 66 | Winston-Salem, North Carolinabig city | 24.6 | 74521 | 302428 |
| 67 | Milwaukee, Wisconsinbig city | 23.9 | 11457 | 240141 |
| 68 | Louisville, Kentuckybig city | 23.8 | 68330 | 345518 |
| 69 | Washington, DCbig city | 23.1 | 75020 | 309826 |
| 70 | Atlanta, Georgiabig city | 22.9 | 73622 | 311924 |
| 71 | Akron, Ohio | 22.8 | 87214 | 285632 |
| 72 | Buffalo, New Yorkbig city | 20.9 | 72923 | 344919 |
| 72 | Spokane, Washington | 20.9 | 61335 | 43937 |
| 74 | Columbia, South Carolina | 20.3 | 79117 | 315723 |
| 75 | Cincinnati, Ohiobig city | 17.4 | 78718 | 360617 |
| 75 | Tulsa, Oklahomabig city | 17.4 | 83415 | 342720 |
| 77 | Seattle, Washingtonbig city | 15.2 | 70625 | 44615 |
| 78 | Houston, Texasbig city | 13.4 | 88812 | 383715 |
| 79 | Portland, Oregonbig city | 13.3 | 70227 | 51130 |
| 80 | Asheville, North Carolina | 12.6 | 75319 | 43946 |
| 81 | Nashville, Tennesseebig city | 12.3 | 96210 | 387315 |
| 82 | Philadelphia, Pennsylvaniabig city | 11.9 | 83117 | 43557 |
| 83 | Denver, Coloradobig city | 10.1 | 88212 | 41448 |
| 84 | Albuquerque, New Mexicobig city | 8.3 | 10308 | 40639 |
| 84 | Salt Lake City, Utah | 8.3 | 86314 | 47712 |
| 86 | Cleveland, Ohiobig city | 7.6 | 13673 | 396912 |
| 86 | Dayton, Ohio | 7.6 | 12296 | 40289 |
| 88 | Baltimore, Marylandbig city | 6.9 | 13514 | 400910 |
| 88 | Detroit, Michiganbig city | 6.9 | 16541 | 395613 |
| 90 | Kansas City, Missouribig city | 6.6 | 13762 | 399111 |
| 91 | Little Rock, Arkansas | 6.5 | 14851 | 397912 |
| 91 | Minneapolis, Minnesotabig city | 6.5 | 10059 | 45204 |
| 93 | Wichita, Kansasbig city | 4.7 | 12107 | 46493 |
| 94 | Birmingham, Alabama | 4.3 | 12394 | 44664 |
| 95 | St. Louis, Missouribig city | 2.9 | 12315 | 50511 |
| 96 | Memphis, Tennesseebig city | 0.7 | 18530 | 50291 |
Not ranked: ten cities whose FBI files fall short
Each city’s number comes from its own police department’s FBI file. For each of the two cities below, that file carries far fewer crimes than the department’s own count, so their rates can’t be compared with other cities’. We leave them off the list rather than rank them on a number the city’s own records contradict.
| City | Why it’s left off |
|---|---|
| Chicago, Illinois | The FBI’s 2025 file counts 11,417 violent crimes for its police department; the city’s own data counts 21,909 violent index crimes that year (FBI Crime Data Explorer; the City of Chicago’s data portal, read September 25, 2026). |
| Jackson, Mississippi | Its police department’s FBI file carries 26 of the 63 homicides the department itself investigated in 2025 (FBI Crime Data Explorer; WLBT, January 1, 2026). |
Eight more cities are left off because their police departments’ 2025 FBI files are missing months, or read far below the state or too far from the year before to trust: Baton Rouge, Louisiana; Bridgeport, Connecticut; Cape Coral, Florida; Daytona Beach, Florida; New Orleans, Louisiana; Orlando, Florida; Savannah, Georgia; and Tucson, Arizona.
Sources and method
- FBI Crime Data Explorer, state summaries · 2025
- CDC National Center for Health Statistics, homicide mortality by state, 2024 (the six unranked states)
How we got this. The Safety Score is The Honest Local’s own recipe. Each source ranks every place on its own from 0 to 100 and the score is the average, so a place has to do well on all of them to lead. The FBI publishes a violent crime rate and a property crime rate for every police department that reports and for every state, so we blend the two instead of leaning on violent crime alone. Safe ought to account for burglary and theft too, not just the rarer, more severe crimes. A city reads its own police department, the Los Angeles Police Department for Los Angeles, and a state reads the FBI's state summary, monthly rates per 100,000 people summed over the latest full calendar year. Each rate ranks every place against every other place of its kind and the average of the two ranks is the score that decides the list; the plain violent crime rate is what we show you. A department that skipped months of reporting, or filed numbers far below anything plausible for its state or its own count (Chicago, and Jackson, Mississippi, whose 2025 FBI file carries 26 of the 63 homicides its police department investigated), reads grey rather than borrowing the state's rate. A state is ranked only when the FBI's file covers at least 90% of its residents (the US as a whole, 96%). Six fall short for 2025: Louisiana, Mississippi, Florida, West Virginia, Indiana and South Dakota. A low rate there can mean missing reports, not less crime, so they sit under the list, unranked, with the CDC's homicide rate instead. It refreshes once a year, when the FBI publishes the prior year. For Provo, Utah, that means FBI Crime Data Explorer, Provo Police Department (agency summary, monthly rates summed), FBI's own published state figure, not a city proxy.
Rankings by The Honest Local from public data, one page per list, refreshed on each source’s own cycle. Places with no reading are left out rather than estimated. Every value on this page carries its source in the page’s structured data.
Photos Farragutful, CC BY-SA 4.0, via Wikimedia Commons · Theunderratedtaco, CC BY-SA 4.0, via Wikimedia Commons · More Than Just Parks.