How much typical home value moved from the month before, biggest rise first.
The Honest LocalA community forum for neighbors
Rankings · Fastest-Rising Home Values by City
Fastest-Rising Home Values by City, Memphis, Tennessee Leads (2026)
Memphis, Tennessee has the fastest-rising home values of the 105 US cities we rank, with home values up 4.4% from the month before (Zillow, 2026-08..2026-09). San Francisco, California is next, with home values up 1.1% from the month before.
By The Honest Local · 105 cities · every value links to its public source
4.4Memphis, Tennessee leads on the list, the highest reading of 105 cities
The top five cities
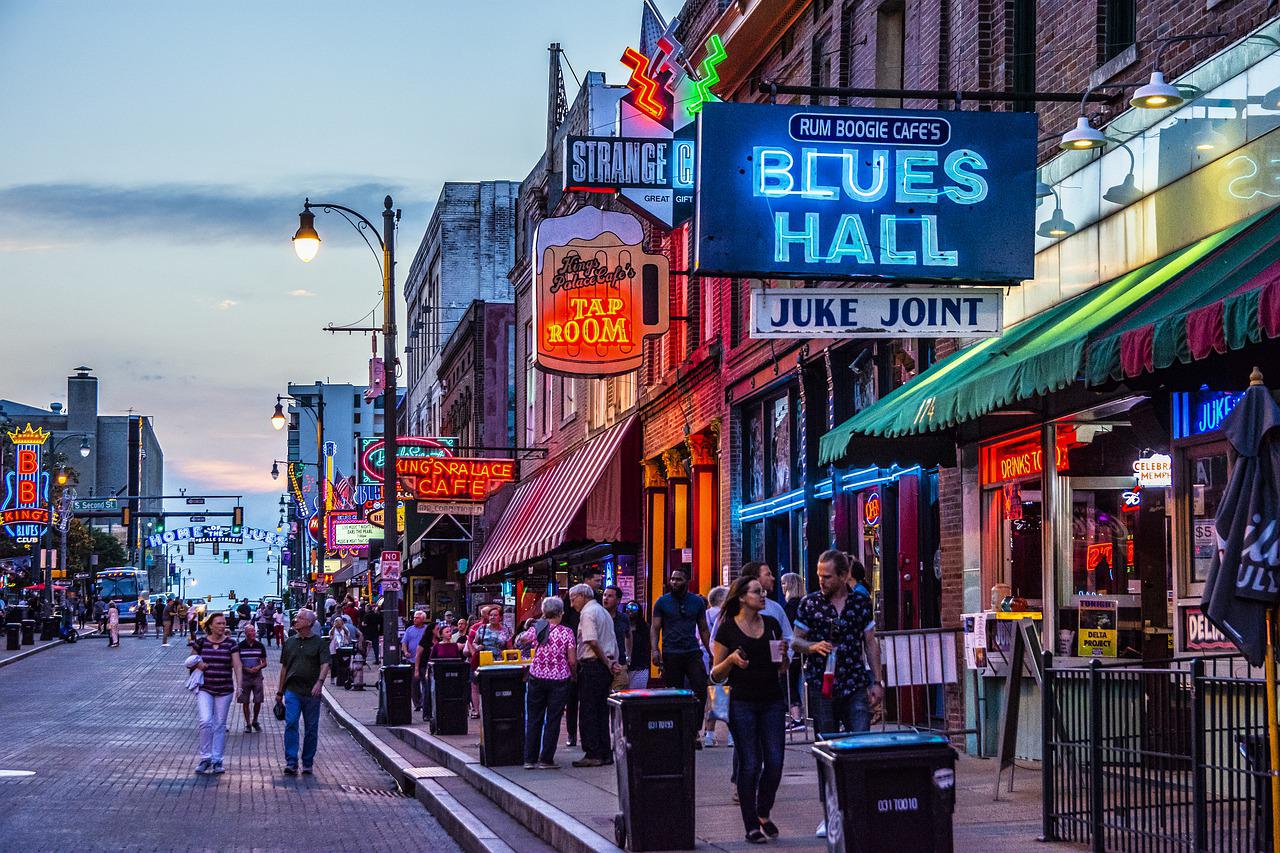
- No. 1Memphis, Tennessee4.4% change
 No. 2San Francisco, California1.1% change
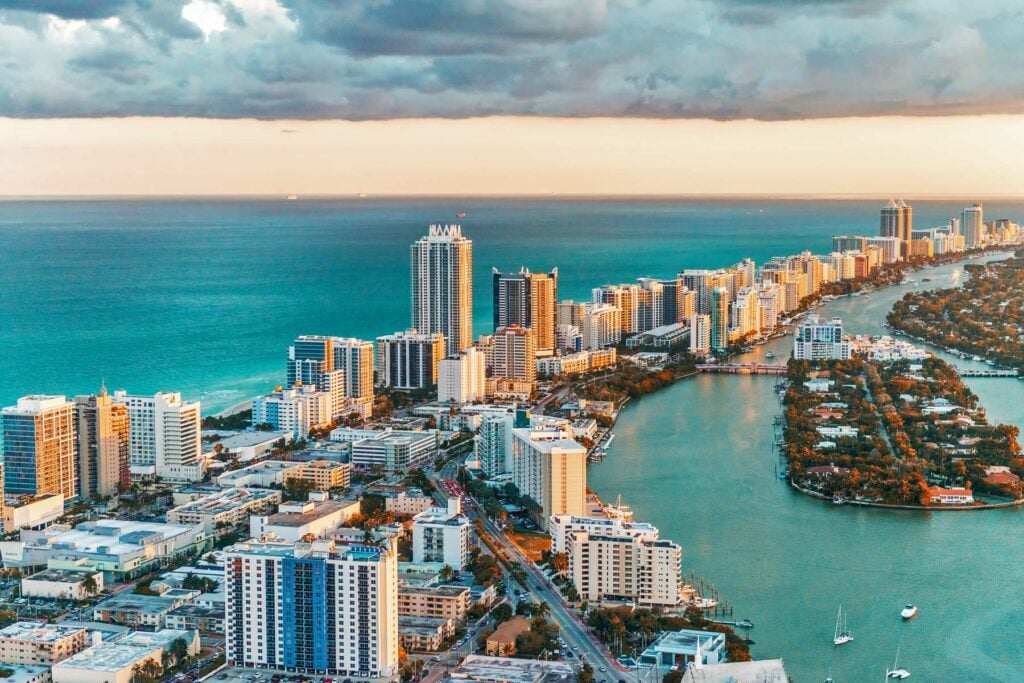 No. 3Miami, Florida0.5% change
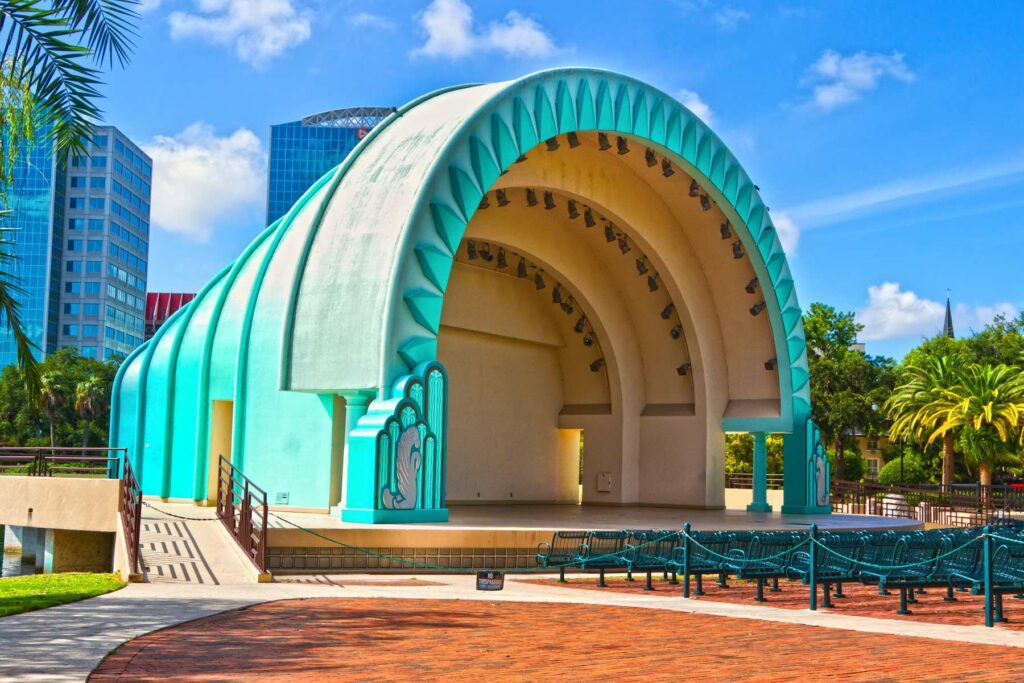 No. 4Orlando, Florida0.5% change
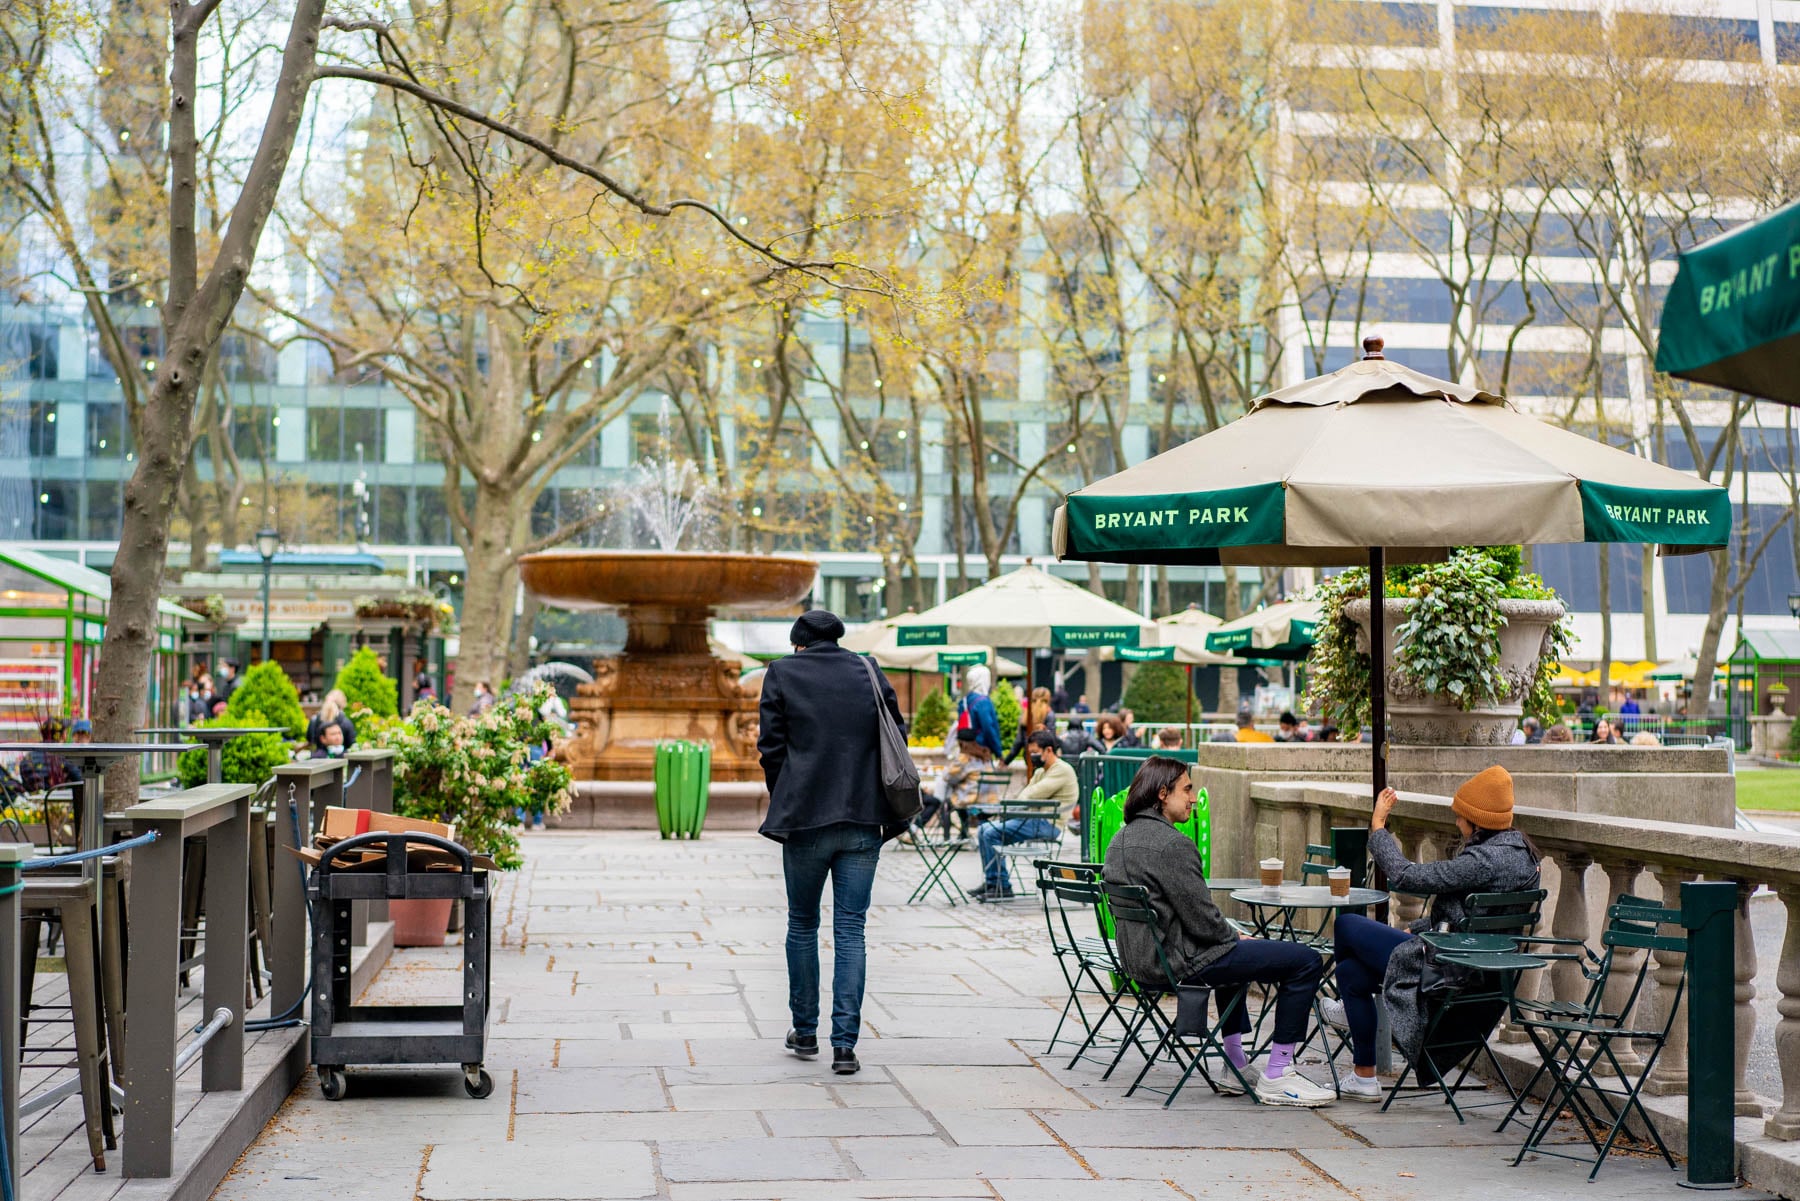 No. 5New York, New York0.4% change
Fastest-Rising Home Values by City on the map
Home value movers, cities
Loading the numbers…
Fastest-Rising Home Values by City, all 105
The full ranking
| Place | % change | |
|---|---|---|
| 1 | Memphis, Tennesseebig city | 4.4 |
| 2 | San Francisco, Californiabig city | 1.1 |
| 3 | Miami, Floridabig city | 0.5 |
| 4 | Orlando, Floridabig city | 0.5 |
| 5 | New York, New Yorkbig city | 0.4 |
| 6 | Sarasota, Florida | 0.3 |
| 7 | Melbourne, Florida | 0.2 |
| 8 | Chicago, Illinoisbig city | 0 |
| 9 | Minneapolis, Minnesotabig city | 0 |
| 10 | Jacksonville, Floridabig city | -0.1 |
| 11 | Lakeland, Florida | -0.2 |
| 12 | Los Angeles, Californiabig city | -0.2 |
| 13 | Oxnard, California | -0.2 |
| 14 | Augusta, Georgia | -0.2 |
| 15 | Honolulu, Hawaiibig city | -0.3 |
| 16 | Reno, Nevadabig city | -0.3 |
| 17 | Albany, New York | -0.3 |
| 17 | Cape Coral, Florida | -0.3 |
| 19 | Albuquerque, New Mexicobig city | -0.4 |
| 20 | El Paso, Texasbig city | -0.4 |
| 21 | Las Vegas, Nevadabig city | -0.4 |
| 21 | Phoenix, Arizonabig city | -0.4 |
| 23 | Provo, Utah | -0.4 |
| 24 | Atlanta, Georgiabig city | -0.4 |
| 24 | Madison, Wisconsinbig city | -0.4 |
| 26 | Colorado Springs, Coloradobig city | -0.5 |
| 27 | Knoxville, Tennessee | -0.5 |
| 27 | San Diego, Californiabig city | -0.5 |
| 29 | Daytona Beach, Florida | -0.5 |
| 29 | New Haven, Connecticut | -0.5 |
| 29 | Tampa, Floridabig city | -0.5 |
| 32 | Salt Lake City, Utah | -0.5 |
| 33 | Riverside, Californiabig city | -0.6 |
| 34 | Allentown, Pennsylvania | -0.6 |
| 35 | Portland, Oregonbig city | -0.6 |
| 35 | Syracuse, New York | -0.6 |
| 37 | Washington, DCbig city | -0.6 |
| 38 | Hartford, Connecticut | -0.6 |
| 39 | Bakersfield, Californiabig city | -0.7 |
| 39 | San Jose, Californiabig city | -0.7 |
| 41 | Louisville, Kentuckybig city | -0.7 |
| 42 | Omaha, Nebraskabig city | -0.7 |
| 42 | Providence, Rhode Island | -0.7 |
| 42 | Sacramento, Californiabig city | -0.7 |
| 45 | Virginia Beach, Virginiabig city | -0.7 |
| 46 | Vancouver, Washington | -0.7 |
| 47 | Denver, Coloradobig city | -0.7 |
| 48 | Boise, Idaho | -0.7 |
| 49 | Charleston, South Carolina | -0.7 |
| 50 | Worcester, Massachusetts | -0.7 |
| 51 | Charlotte, North Carolinabig city | -0.7 |
| 52 | Dallas, Texasbig city | -0.8 |
| 53 | New Orleans, Louisianabig city | -0.8 |
| 54 | Richmond, Virginia | -0.8 |
| 55 | Portland, Maine | -0.8 |
| 55 | Spokane, Washington | -0.8 |
| 57 | Houston, Texasbig city | -0.9 |
| 57 | Little Rock, Arkansas | -0.9 |
| 59 | Nashville, Tennesseebig city | -0.9 |
| 60 | Philadelphia, Pennsylvaniabig city | -0.9 |
| 60 | St. Louis, Missouribig city | -0.9 |
| 62 | Bridgeport, Connecticut | -0.9 |
| 62 | Raleigh, North Carolinabig city | -0.9 |
| 64 | Asheville, North Carolina | -0.9 |
| 65 | Greenville, South Carolina | -1 |
| 66 | Tucson, Arizonabig city | -1 |
| 67 | McAllen, Texas | -1 |
| 68 | Greensboro, North Carolinabig city | -1 |
| 69 | Grand Rapids, Michigan | -1 |
| 70 | Baltimore, Marylandbig city | -1 |
| 70 | Fresno, Californiabig city | -1 |
| 70 | Savannah, Georgia | -1 |
| 73 | Fayetteville, Arkansas | -1.1 |
| 73 | Wichita, Kansasbig city | -1.1 |
| 75 | Austin, Texasbig city | -1.1 |
| 76 | Indianapolis, Indianabig city | -1.1 |
| 76 | Tulsa, Oklahomabig city | -1.1 |
| 78 | Huntsville, Alabama | -1.1 |
| 78 | Stockton, Californiabig city | -1.1 |
| 80 | San Antonio, Texasbig city | -1.1 |
| 80 | Winston-Salem, North Carolinabig city | -1.1 |
| 82 | Harrisburg, Pennsylvania | -1.2 |
| 83 | Oklahoma City, Oklahomabig city | -1.2 |
| 84 | Des Moines, Iowa | -1.2 |
| 84 | Ogden, Utah | -1.2 |
| 86 | Durham, North Carolinabig city | -1.3 |
| 87 | Seattle, Washingtonbig city | -1.3 |
| 88 | Chattanooga, Tennessee | -1.3 |
| 89 | Columbia, South Carolina | -1.3 |
| 90 | Kansas City, Missouribig city | -1.3 |
| 90 | Toledo, Ohiobig city | -1.3 |
| 92 | Cincinnati, Ohiobig city | -1.4 |
| 93 | Baton Rouge, Louisiana | -1.6 |
| 94 | Columbus, Ohiobig city | -1.6 |
| 95 | Boston, Massachusettsbig city | -1.7 |
| 96 | Milwaukee, Wisconsinbig city | -1.9 |
| 97 | Buffalo, New Yorkbig city | -1.9 |
| 97 | Dayton, Ohio | -1.9 |
| 99 | Birmingham, Alabama | -2 |
| 100 | Akron, Ohio | -2 |
| 101 | Pittsburgh, Pennsylvaniabig city | -2.2 |
| 102 | Rochester, New York | -2.8 |
| 103 | Detroit, Michiganbig city | -3.2 |
| 104 | Jackson, Mississippi | -3.3 |
| 105 | Cleveland, Ohiobig city | -3.8 |
Sources and method
- Zillow Home Value Index · 2026-08..2026-09
How we got this. The change in Zillow's typical home value from the month before, both months from Zillow's own series. First place is the biggest rise. A place whose home value moved more than 5 percent in a single month stays off the list until the next month confirms it, so a glitch in the source never takes first place. Once we hold twelve months of our own readings, the list measures the year instead. It refreshes monthly, when Zillow publishes.
Rankings by The Honest Local from public data, one page per list, refreshed on each source’s own cycle. Places with no reading are left out rather than estimated. Every value on this page carries its source in the page’s structured data.
Photos More Than Just Parks · Shutterstock/Pisaphotography · Shutterstock.