How strong the sun is, from NASA satellites, blended with how many days a year it actually rains, from NOAA. The number shown is peak sun hours a day.
The Honest LocalA community forum for neighbors
Rankings · Sunniest Cities
Sunniest Cities, Phoenix, Arizona Leads (2026)
Phoenix, Arizona is the sunniest of the 106 US cities we rank, with a Sunshine Score of 98.4 out of 100 and 5.8 peak sun hours a day (NASA, 2021-2025). Las Vegas, Nevada is next, with a Sunshine Score of 97.1.
By The Honest Local · 106 cities · every value links to its public source
98.4Phoenix, Arizona leads on The Honest Local Sunshine Score, 106 cities, the 100 largest metro areas and every city we coverHow strong the sun is and how rarely it rains, blended into one number.

The top five cities
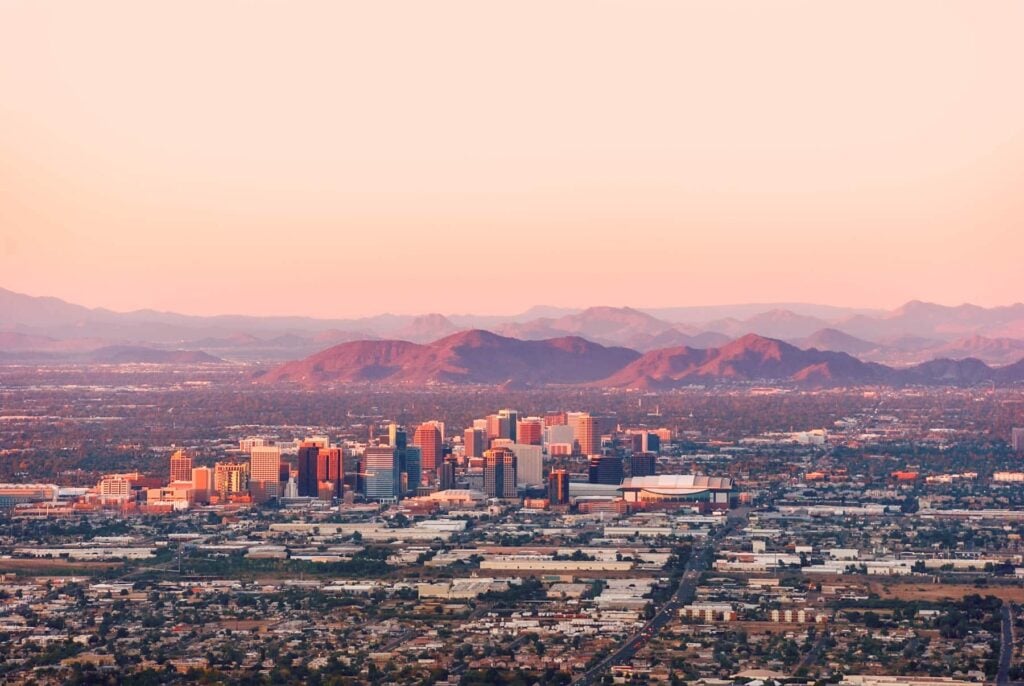 No. 1Phoenix, Arizona98.45.8 peak sun hours a day
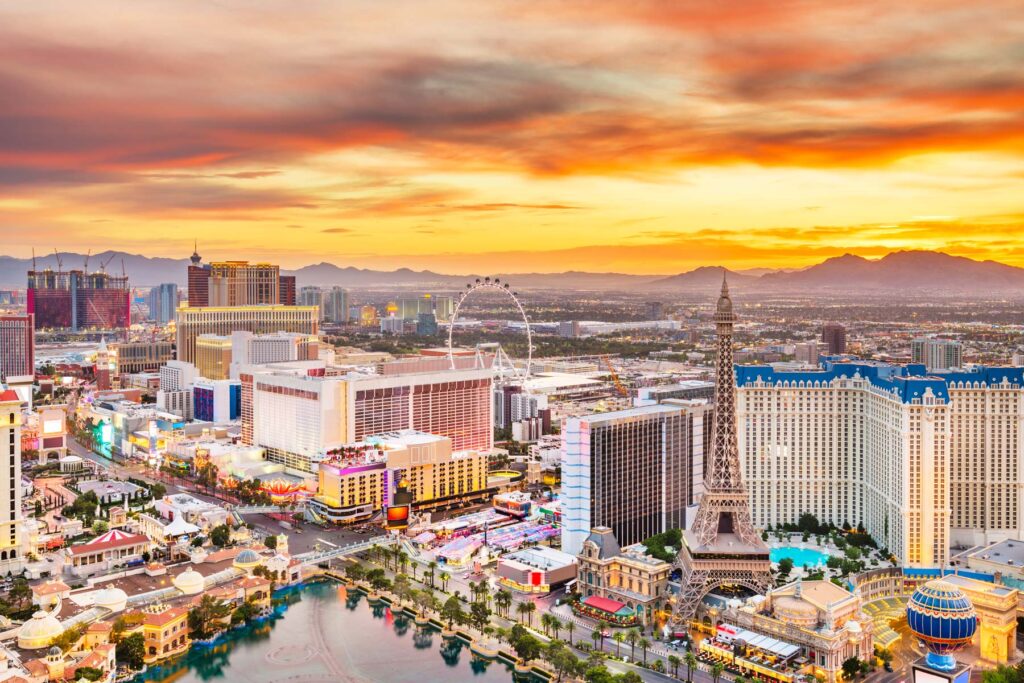 No. 2Las Vegas, Nevada97.15.5 peak sun hours a day
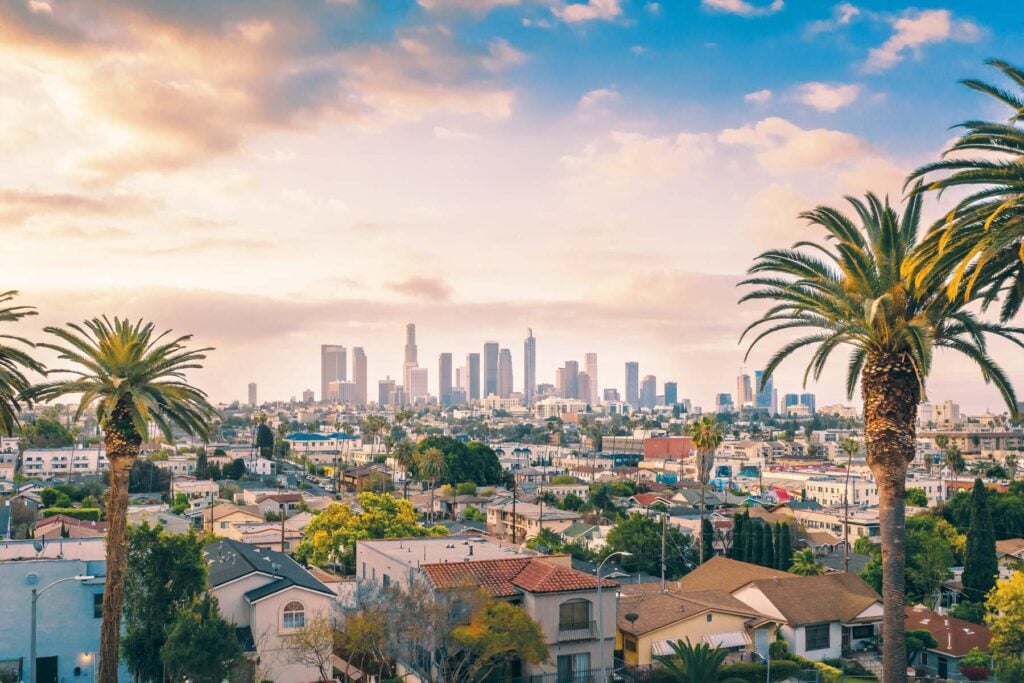 No. 3Los Angeles, California96.85.6 peak sun hours a day
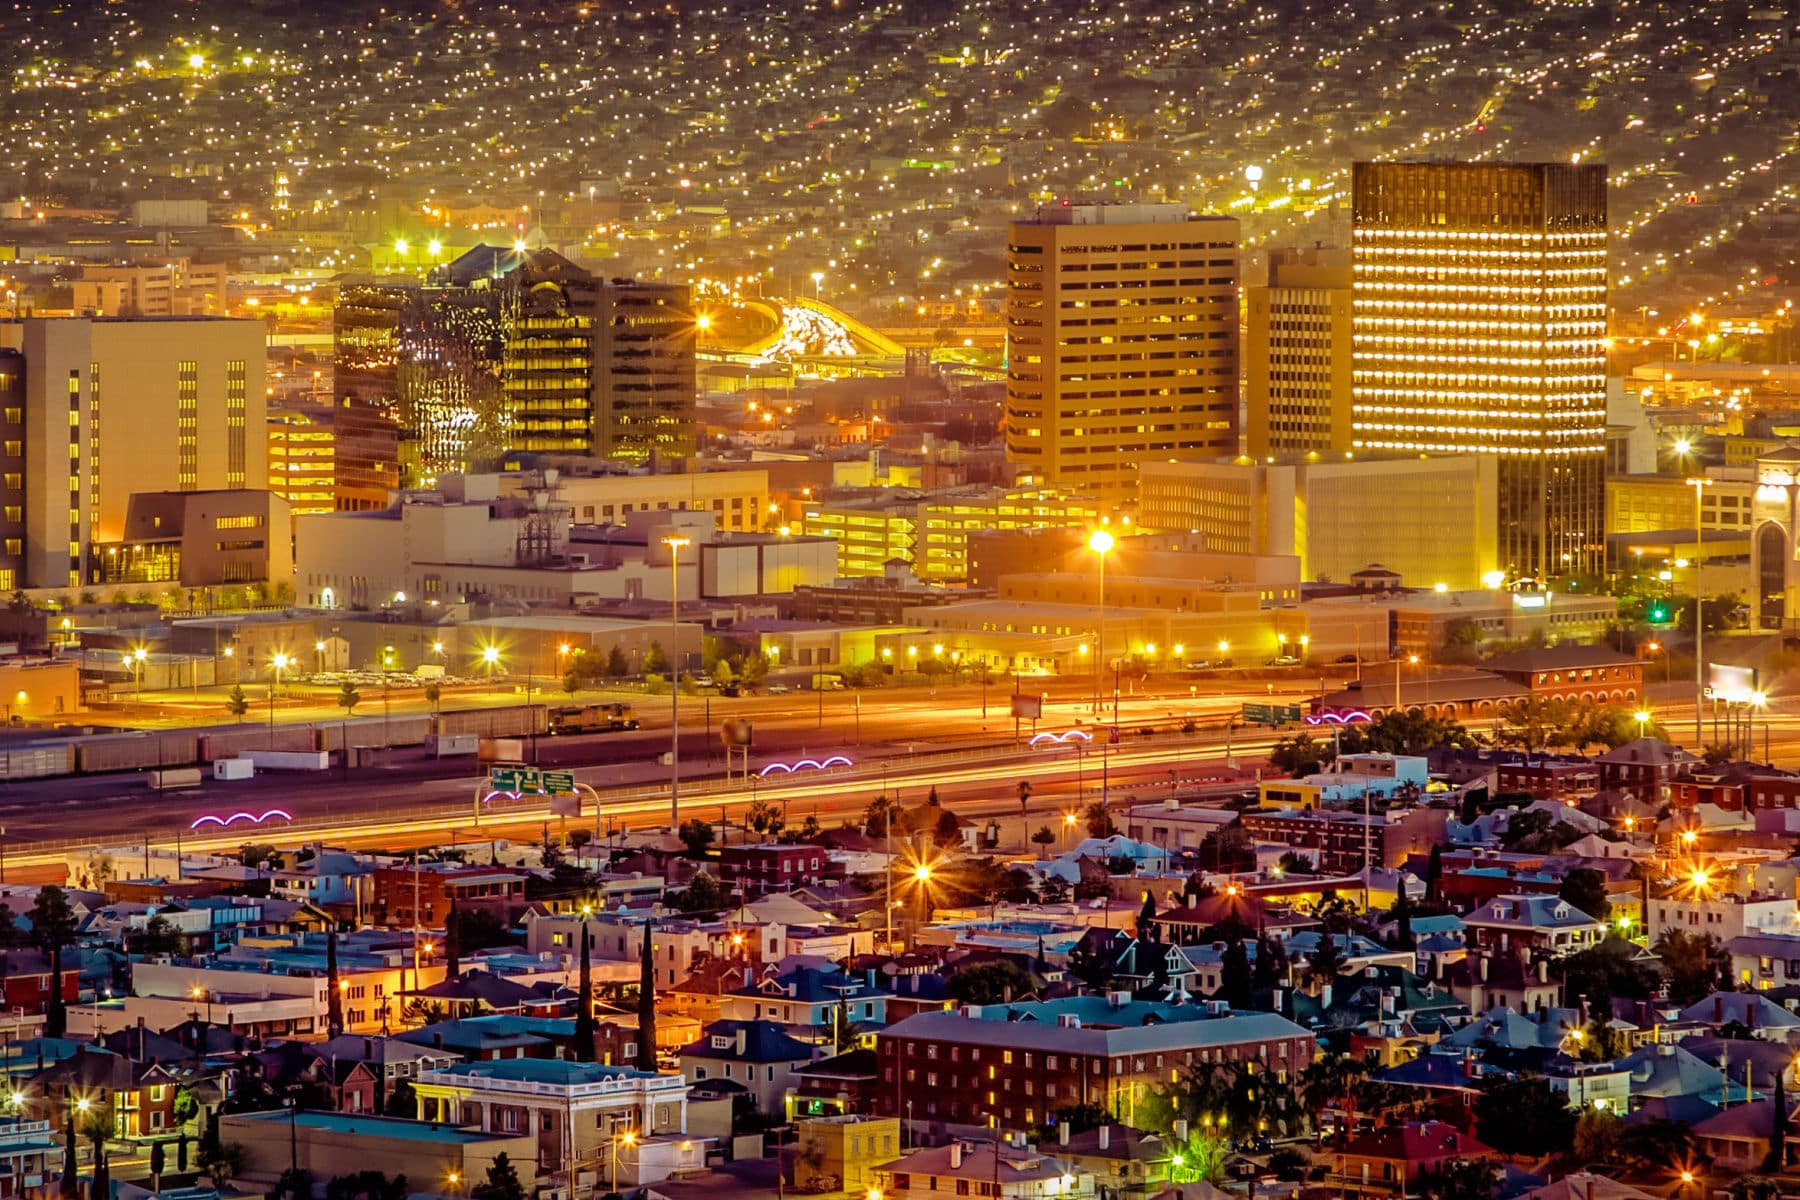 No. 4El Paso, Texas95.95.9 peak sun hours a day
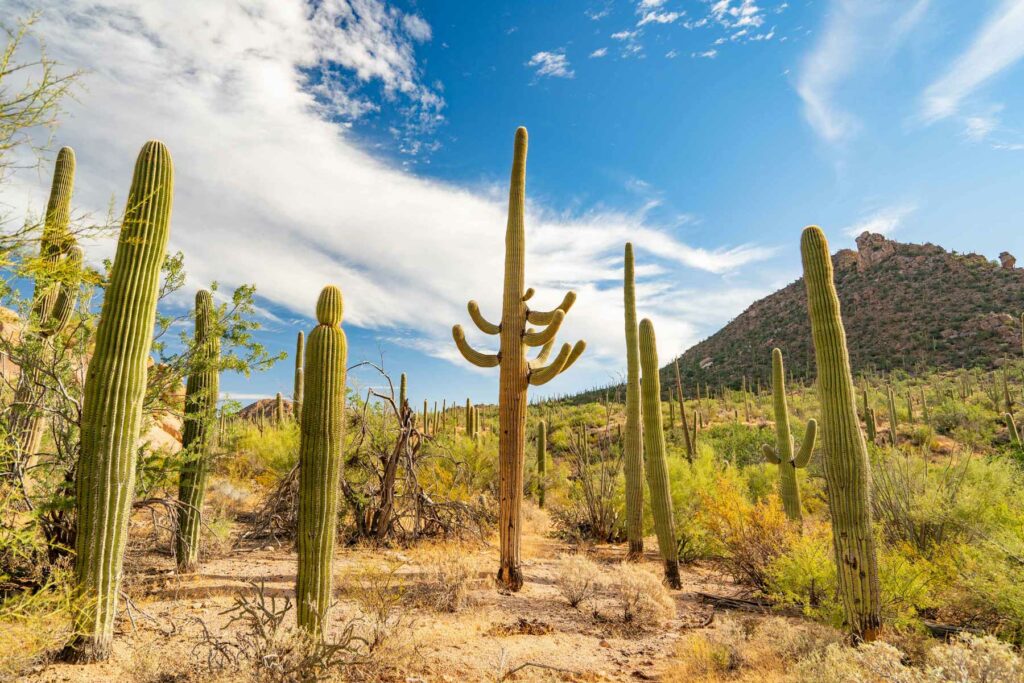 No. 5Tucson, Arizona95.85.8 peak sun hours a day
Sunniest Cities on the map
Sunshine Score, cities
Loading the numbers…
Sunniest Cities, all 106
The full ranking
| Place | Sunshine Scoreout of 100 | Sun strengthpeak sun hours a day | Wet daysa year | |
|---|---|---|---|---|
| 1 | Phoenix, Arizonabig city | 98.4 | 5.8098 | 3399 |
| 2 | Las Vegas, Nevadabig city | 97.1 | 5.5094 | 26100 |
| 3 | Los Angeles, Californiabig city | 96.8 | 5.6096 | 3498 |
| 4 | El Paso, Texasbig city | 95.9 | 5.9099 | 4892 |
| 5 | Tucson, Arizonabig city | 95.8 | 5.8099 | 4793 |
| 6 | Bakersfield, Californiabig city | 95.6 | 5.6095 | 3896 |
| 7 | Oxnard, California | 93.9 | 5.5093 | 4495 |
| 7 | Riverside, Californiabig city | 93.9 | 5.4090 | 3597 |
| 9 | Fresno, Californiabig city | 92.6 | 5.4091 | 4794 |
| 10 | Albuquerque, New Mexicobig city | 91.4 | 5.5092 | 5690 |
| 11 | Stockton, Californiabig city | 89.6 | 5.3089 | 5790 |
| 12 | San Jose, Californiabig city | 89.3 | 5.3089 | 5989 |
| 13 | Reno, Nevadabig city | 88.8 | 5.2086 | 5192 |
| 14 | Sacramento, Californiabig city | 88.2 | 5.3088 | 6189 |
| 15 | San Diego, Californiabig city | 87.2 | 4.9079 | 4096 |
| 16 | Honolulu, Hawaiibig city | 87.1 | 5.8097 | 8978 |
| 17 | McAllen, Texas | 86.2 | 5.1085 | 6288 |
| 18 | San Antonio, Texasbig city | 82.7 | 4.9080 | 8185 |
| 19 | Colorado Springs, Coloradobig city | 82.4 | 5.0083 | 8781 |
| 20 | San Francisco, Californiabig city | 81.8 | 4.8076 | 7187 |
| 21 | Denver, Coloradobig city | 81.4 | 4.9077 | 8086 |
| 22 | Austin, Texasbig city | 80.8 | 4.9078 | 8683 |
| 23 | Dallas, Texasbig city | 78.9 | 4.8071 | 7987 |
| 24 | Oklahoma City, Oklahomabig city | 78.2 | 4.8072 | 8385 |
| 25 | Ogden, Utah | 77.9 | 4.8073 | 8683 |
| 26 | Tampa, Floridabig city | 76.2 | 5.2087 | 10865 |
| 27 | Provo, Utah | 75.4 | 4.8075 | 9276 |
| 27 | Salt Lake City, Utah | 75.4 | 4.8075 | 9276 |
| 29 | Wichita, Kansasbig city | 75 | 4.7068 | 8782 |
| 30 | Sarasota, Florida | 73.9 | 5.2087 | 11361 |
| 31 | Cape Coral, Florida | 69 | 5.1085 | 11653 |
| 32 | Houston, Texasbig city | 68 | 4.7066 | 10470 |
| 33 | Boise, Idaho | 67.9 | 4.6058 | 8978 |
| 34 | Savannah, Georgia | 67.3 | 4.7069 | 10866 |
| 35 | Jacksonville, Floridabig city | 65.7 | 4.8076 | 11456 |
| 35 | Tulsa, Oklahomabig city | 65.7 | 4.6058 | 9474 |
| 37 | Augusta, Georgia | 65.4 | 4.6064 | 10767 |
| 38 | Jackson, Mississippi | 64.4 | 4.7064 | 10965 |
| 39 | Charleston, South Carolina | 63.8 | 4.7071 | 11457 |
| 40 | New Orleans, Louisianabig city | 61.9 | 4.7070 | 11554 |
| 41 | Melbourne, Florida | 61.3 | 5.0081 | 12042 |
| 42 | Baton Rouge, Louisiana | 61.2 | 4.7067 | 11455 |
| 43 | Columbia, South Carolina | 60.6 | 4.6057 | 10964 |
| 44 | Orlando, Floridabig city | 60.4 | 5.0082 | 12139 |
| 45 | Little Rock, Arkansas | 59.6 | 4.5051 | 10669 |
| 46 | Charlotte, North Carolinabig city | 58.7 | 4.5056 | 11262 |
| 47 | Memphis, Tennesseebig city | 58.3 | 4.5054 | 11163 |
| 48 | Daytona Beach, Florida | 58 | 4.8074 | 11942 |
| 49 | Fayetteville, Arkansas | 57.4 | 4.5056 | 11358 |
| 50 | Kansas City, Missouribig city | 56.7 | 4.3043 | 10471 |
| 51 | Omaha, Nebraskabig city | 56.4 | 4.3041 | 10372 |
| 52 | Greenville, South Carolina | 56.1 | 4.6062 | 11750 |
| 53 | Atlanta, Georgiabig city | 55.5 | 4.6060 | 11651 |
| 54 | Lakeland, Florida | 54 | 5.0082 | 12826 |
| 55 | Birmingham, Alabama | 52.9 | 4.6059 | 11847 |
| 56 | Durham, North Carolinabig city | 51.8 | 4.5055 | 11849 |
| 56 | Raleigh, North Carolinabig city | 51.8 | 4.5055 | 11849 |
| 58 | Greensboro, North Carolinabig city | 50.7 | 4.4049 | 11652 |
| 59 | Huntsville, Alabama | 50 | 4.5051 | 11849 |
| 60 | Des Moines, Iowa | 49.7 | 4.2040 | 11359 |
| 61 | St. Louis, Missouribig city | 49.1 | 4.3042 | 11456 |
| 62 | Virginia Beach, Virginiabig city | 47.2 | 4.4048 | 11846 |
| 63 | Miami, Floridabig city | 46.8 | 5.1084 | 14110 |
| 64 | Richmond, Virginia | 44.3 | 4.3044 | 11945 |
| 65 | Washington, DCbig city | 43.6 | 4.2040 | 11847 |
| 66 | Chattanooga, Tennessee | 41 | 4.4046 | 12337 |
| 67 | Winston-Salem, North Carolinabig city | 40.4 | 4.4049 | 12532 |
| 68 | Nashville, Tennesseebig city | 39.1 | 4.3042 | 12336 |
| 69 | Spokane, Washington | 38.5 | 3.9017 | 11360 |
| 70 | Philadelphia, Pennsylvaniabig city | 38.2 | 4.1036 | 12140 |
| 71 | Baltimore, Marylandbig city | 36.9 | 4.1035 | 12139 |
| 72 | Asheville, North Carolina | 35.9 | 4.4050 | 13022 |
| 73 | Knoxville, Tennessee | 35.6 | 4.4047 | 12924 |
| 74 | Louisville, Kentuckybig city | 35.3 | 4.1037 | 12534 |
| 75 | Minneapolis, Minnesotabig city | 32.1 | 3.9021 | 11944 |
| 76 | New Haven, Connecticut | 30 | 3.9025 | 12435 |
| 77 | Indianapolis, Indianabig city | 29.8 | 4.1034 | 12826 |
| 78 | New York, New Yorkbig city | 29.3 | 4.0027 | 12531 |
| 79 | Providence, Rhode Island | 29 | 4.0031 | 12727 |
| 80 | Chicago, Illinoisbig city | 27 | 3.9024 | 12630 |
| 81 | Bridgeport, Connecticut | 26.5 | 3.9020 | 12533 |
| 82 | Dayton, Ohio | 23.9 | 4.1033 | 13415 |
| 83 | Cincinnati, Ohiobig city | 23.3 | 4.1033 | 13614 |
| 84 | Hartford, Connecticut | 22.9 | 3.9025 | 13021 |
| 85 | Harrisburg, Pennsylvania | 22.4 | 3.9022 | 12922 |
| 86 | Madison, Wisconsinbig city | 22.1 | 3.8015 | 12629 |
| 87 | Columbus, Ohiobig city | 21.2 | 4.1032 | 14110 |
| 88 | Allentown, Pennsylvania | 20.9 | 3.9019 | 12923 |
| 89 | Toledo, Ohiobig city | 19.3 | 3.9023 | 13315 |
| 90 | Boston, Massachusettsbig city | 19.1 | 3.8014 | 12824 |
| 91 | Poughkeepsie, New York | 18.2 | 3.9020 | 13217 |
| 92 | Milwaukee, Wisconsinbig city | 18 | 3.705 | 12631 |
| 93 | Portland, Maine | 13.1 | 3.808 | 13118 |
| 94 | Worcester, Massachusetts | 12.7 | 3.8014 | 13812 |
| 95 | Detroit, Michiganbig city | 12.5 | 3.8012 | 13613 |
| 96 | Akron, Ohio | 11.4 | 3.707 | 13316 |
| 97 | Pittsburgh, Pennsylvaniabig city | 10.6 | 3.8015 | 1546 |
| 98 | Albany, New York | 8.4 | 3.706 | 13911 |
| 98 | Grand Rapids, Michigan | 8.4 | 3.809 | 1498 |
| 100 | Portland, Oregonbig city | 6.9 | 3.8010 | 1574 |
| 101 | Vancouver, Washington | 6.3 | 3.8010 | 1633 |
| 102 | Cleveland, Ohiobig city | 5 | 3.707 | 1593 |
| 103 | Seattle, Washingtonbig city | 3.2 | 3.601 | 1565 |
| 104 | Rochester, New York | 2 | 3.603 | 1681 |
| 105 | Buffalo, New Yorkbig city | 1.9 | 3.602 | 1662 |
| 105 | Syracuse, New York | 1.9 | 3.604 | 1740 |
Sources and method
How we got this. The Sunshine Score is The Honest Local’s own recipe. Each source ranks every place on its own from 0 to 100 and the score is the average, so a place has to do well on all of them to lead. We don't trust one reading to call a place sunny, so we combine two. NASA's measure of how much sunlight reaches the ground each day, and NOAA's count of how many days a year it actually rains, turned around so fewer wet days scores higher. Each source ranks every place against every other place that has it, and the average of the two ranks is the score that decides the list. The number we show you is peak sun hours a day, the solar industry's plain measure: one peak sun hour is a kilowatt-hour of sunlight on a square meter. We used to show NASA's count of clear-sky days, but it only counts days under 10% cloud, which gave Miami three a year, so it no longer counts. A city uses its own coordinates and its own weather station. For a state we never hand you one city's reading and call it the state's. We take its five largest cities, weight them by population, and run every source across all five. When a place is missing one source we score it on the one it has and say so in its row. It refreshes once a year, when NASA and NOAA publish. For Phoenix, Arizona, that means NASA POWER at Phoenix's own coordinate; annual mean of the five 2021-2025 totals.
Rankings by The Honest Local from public data, one page per list, refreshed on each source’s own cycle. Places with no reading are left out rather than estimated. Every value on this page carries its source in the page’s structured data.
Photos Shutterstock · Shutterstock/Marek Masik · More Than Just Parks.